Link to Dashboard
Evrymap’s dashboard is linked to an Apache Superset, connected to a database, which gives optical information of the data as well as visual information in the form of diagrams. As it is evident on the home page of the map, all the measurement stations are located where the telemetry data of the waters will be monitored in the catchment basins of the rivers Evros, Nestos and Strymonas. By right-clicking on one of the available stations on the map the user gets the following options as shown in Figure 19 and analysed below.
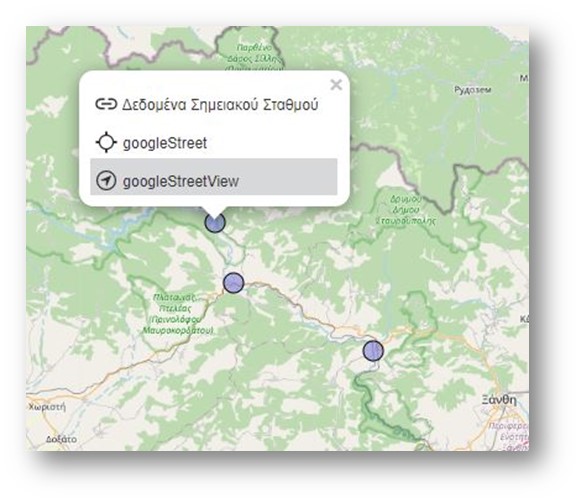
Figure 19: Available information for each water monitoring station
- Data of each water point station
By clicking on this option, the user is automatically taken to a new window where all the indicator measurements (water pH, water temperature, water level, depth of the measurement etc.) are presented in a diagram form for the selected water monitoring point station. An image with the available indicators is shown in Figure 20 below:
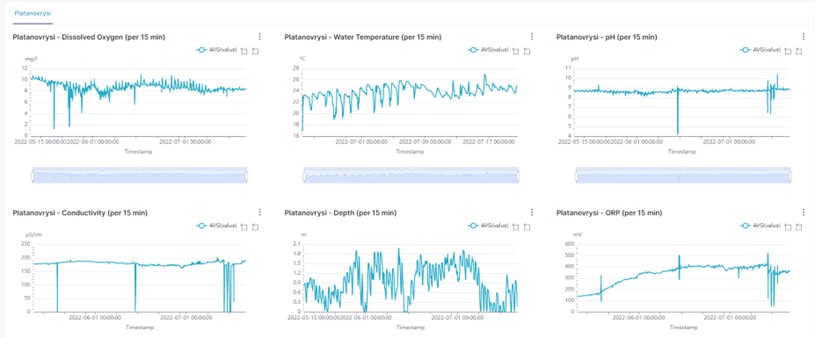
Figure 20: Graphical information of the water station
For each indicator there is the corresponding diagram where some combined changes can be done to reach the desired outcome. More specifically, as shown in Figure 21, the user can define the time period he is interested in ![]() , review the price for the specific time period
, review the price for the specific time period ![]() , focus on the price range he is interested in and restore the chart to its original state
, focus on the price range he is interested in and restore the chart to its original state ![]() . Finally, option
. Finally, option ![]() gives the possibility to download the data either in image format or export in .csv format (Figure 22).
gives the possibility to download the data either in image format or export in .csv format (Figure 22).
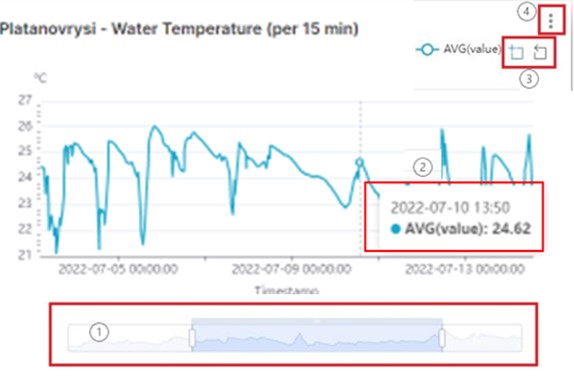
Figure 21: Diagram of the water temperature in Platanovrysi
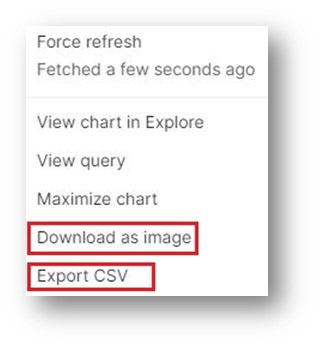
Fiigure 22: The download options
- Google Maps
Another available option is Google maps which the user can select by right clicking on the water point float station. The location and the coordinates of the specific monitoring station opens in a new window in Google maps as shown in Figure 23 below.
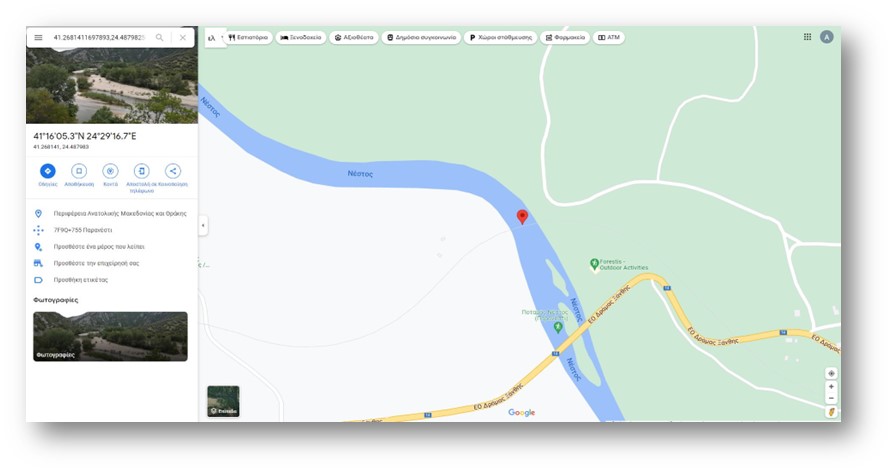
Figure 23: The location of the water station as shown in Google maps
- Google Street View
The last option is the Google Street view which opens the location of the water measurement point in a new window for viewing.
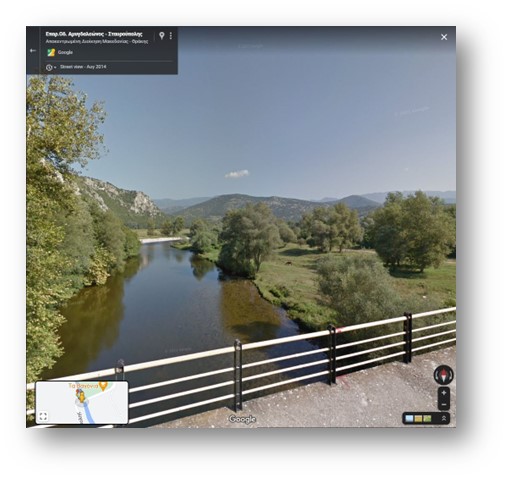
Figure 24: Location of the point station in Google Street View